
In my work advising business owners I’m often asked the following question – “how much profit should I be making?” Or to put it another way, “how much profit is enough?”
Often a business owner will advise me that they’re making a certain gross profit margin (GP margin) or certain net profit. Sometimes, the GP margin might appear reasonable and other times it might not. Then I ask them how many products or services they provide. “How many distribution channels do you have? Do you sell online, wholesale, retail etc.?” Usually, the answer is that they sell more than one product or service, usually many more. Sometimes they’ll even sell through multiple distribution channels.
Granularity
I then ask them – “do you have granularity over the profitability of each individual product or service and/or distribution channel?” The response is usually a blank look, before the inevitable “aha” moment. The reality is that whilst a business may achieve a GP margin of say 40%, you can be sure that it is not achieving 40% on every single product, service or distribution channel. On some lines, the margin may be higher. On others it will be lower.
In my experience, the reality is that many businesses do not have a clear picture on which of their product or service lines are profitable and which aren’t.
Boston Matrix
The Boston Matrix is a useful model to use to focus attention on this issue. There appear to be numerous different examples of the Boston Matrix. Below is an example of the one I use.
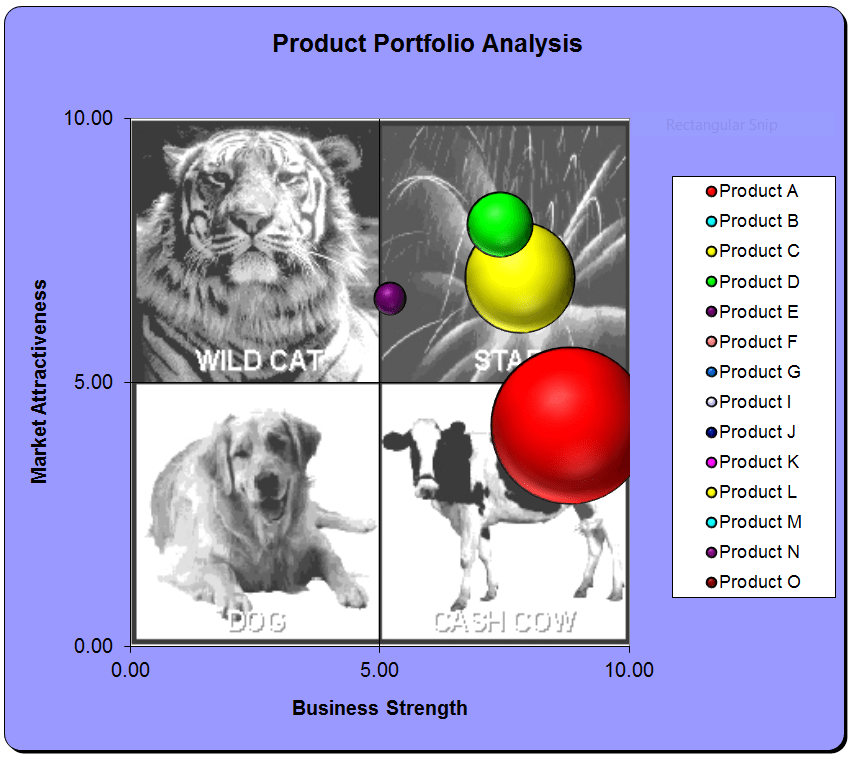
As you will see, it focuses on two axes:
- The x axis (or horizontal axis) focusing on Business Strength. In other words, how good is the business at producing the various products or services? These attributes are usually internal to the organisation.
- The y axis (or vertical axis) focuses on the Market Attractiveness of the various products or services sold by the business. These attributes are usually external to the business.
The challenge is to then come up with a series of criteria for determining where a particular product, service or distribution channel fits on the x and y axis. For example, some factors that may indicate the market attractiveness of a particular product could include:
- The growth potential of the market
- Margin or profitability
- Market size
Some factors that may indicate whether the business has business strengths in each product could include:
- Production efficiency
- Product quality
- The skills and knowledge of the business
Dog, cash cow, star or wildcat?
The key is to then allocate a score (out of 10) to each attribute of the x and y axis for each product line, service or distribution channel, as well as a total sales figure for each product. The sales figure will help you assess the size of the portion of your business that is either a dog, cash cow, star or wildcat.
The challenge is to rid the business of dogs, use cash cows to fund the development of wildcats which may in turn develop into stars.
Whilst this may be helpful at a superficial level, it doesn’t help identify how profitable each of these products and services are to your business. Often, there will be different costs to purchase raw materials for a particular product. There may also be different labour and overhead costs. In my experience, a large number of SMEs don’t allocate costs with sufficient clarity. They are therefore unable to achieve a true appreciation of the profitability of individual product lines or distribution channels. The result of this is to continue selling dogs which are subsidised by stars and cash cows.
Activity Based Costing
In my view, the most appropriate manner to obtain clarity on product profitability is by Activity Based Costing. However, this is not always feasible or economical for many SMEs. For this reason, I recommend that business owners apply the Pareto principle. In other words, spend 20% of the effort to get 80% of the information, not the other way around. So I try to encourage them to focus on allocating the main operating costs to product lines initially. They can then refine it down the track if they want more precise information.
Costs that may typically fall into the “easy to allocate” bucket include purchases or raw materials, direct labour, premises and plant and machinery costs. In my experience, this can be achieved in even basic accounting packages by creating “jobs.” Alternatively code the above costs to a “job”, which may be a particular product, product category or distribution channel.
Once you are able to identify which product categories are not as profitable as others, you can then implement a strategy to address it. As the saying goes – what you can measure, you can manage. If you’re not measuring it, you can be sure you’re not managing it, meaning you’re flying blind.